|
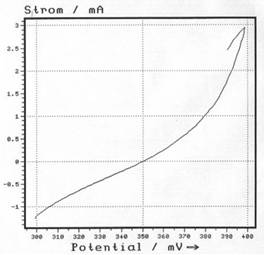
Polarisation curves are measured with a 3-electrode configuration (measurement electrode, counter
electrode and reference electrode). Measurements are performed either in the potentiostatic, potentidynamic
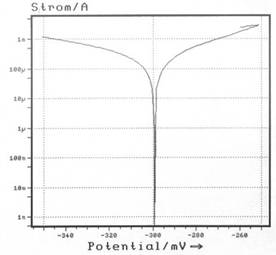
or in the galvanostatic mode. The current density at the open circuit potential is determined by Tafel-extrapolation. From this, the stock removal per year can be calculated. Example: Pure iron in 1 N H2SO4; Potential sweep rate 100 µV/s |
|
| linear plot: | logarithmic plot: |
 |
 |
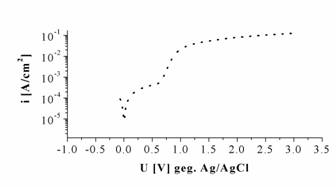
Example for semiconductor electrochemistry: n-InP in 1 M HF; Potential sweep rate 10 mV/s |
|
 |
|
|
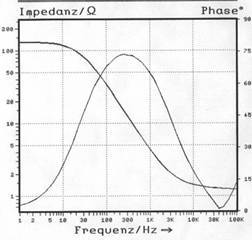
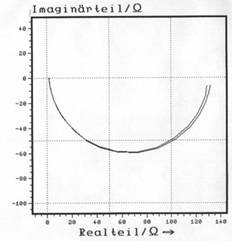
For the impedance spectroscopy ,mainly a 3-electrode configuration (measurement electrode, counter electrode and reference electrode). Contrary to the polaristaion curves, impedance spectroscopy is a method with alternating current and alternating potential. |
|
| Example: Pure iron in 1 N H2SO4 | |
| Bode-Plot: | Nyquist-Plot: |
 |
 |
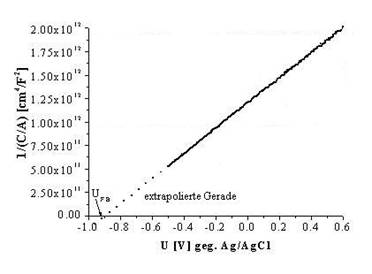
| Example for semiconductor electrochemistry: n-InP in 1 M HF; Mott-Schottky-Plott | |
 |
|